
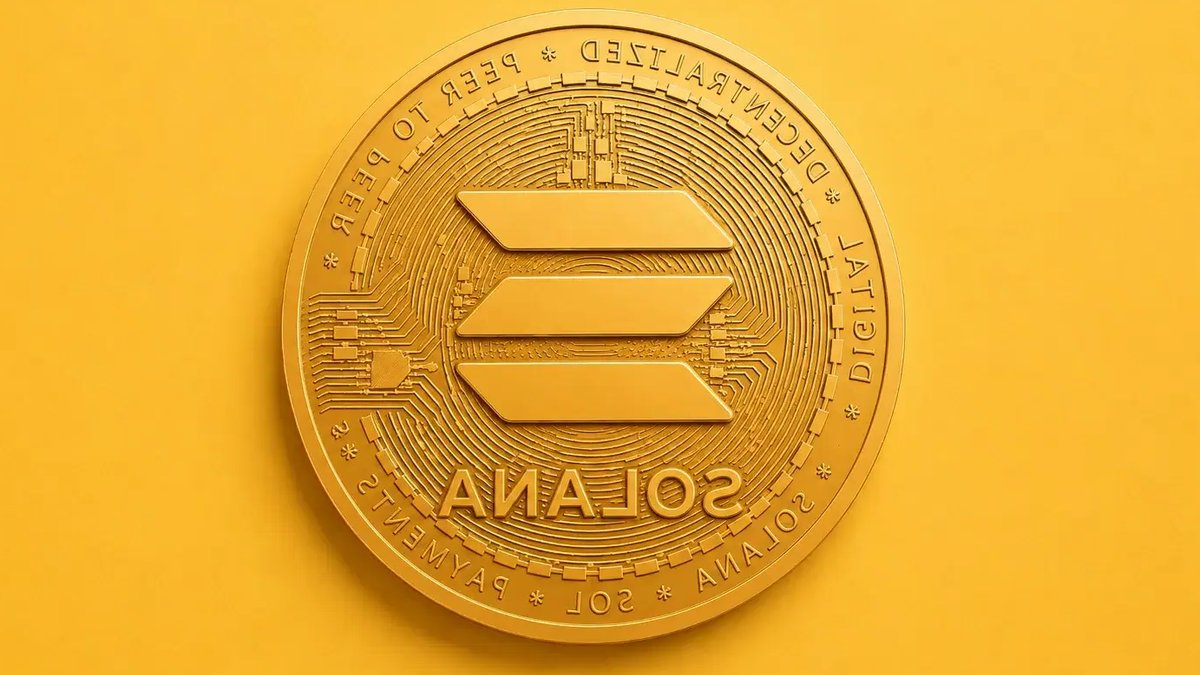
Solana traded near $76 on Monday, boxed inside a tight range that has contained it since June. The token has stabilized after summer lows but remains unable to break the ceiling that caps it, sitting wedged between support at roughly $74 and resistance near $78 to $80. SOL has spent weeks grinding sideways between roughly $63 and $80, and the current price sits in the upper portion of that band.
The context for why $76 feels like a battleground is the depth of the decline that preceded it. Solana reached an all-time high of $294.87 at the peak of its cycle, and the collapse since has erased roughly three-quarters of that value, dragging the token to the mid-$70s where it now consolidates. To revisit its record, SOL would need to rise nearly 286% from current levels — a measure of how far the token has fallen and how long the climb back would be.
Solana has closed nine consecutive red months, an extended losing streak that reflects sustained selling pressure across the better part of a year. Nine red months in a row is a heavy weight for any asset to shake off, because it signals a durable downtrend rather than a brief correction — the kind of persistent weakness that erodes conviction and keeps the token pinned near its lows. The streak is the defining feature of Solana’s 2026, and the recent stabilization is the first tentative sign it might be ending.
The historical pattern offers both caution and hope. Solana experienced a similar deep drawdown in a prior cycle, falling from its first all-time high to a fraction of that value before staging a multi-year recovery to a new record. That precedent shows the token is capable of violent declines followed by powerful recoveries, but it also shows the recoveries take time — the prior cycle required roughly three years to reach a new high. The nine-red-month streak fits the pattern of a deep bear phase that must run its course before a durable recovery can begin.
The setup is a market coiling inside a defined box. Below spot, support has formed at $74.22 and the shorter-term moving averages near $76.80, backed by the critical $63-$65 floor that has held through the downtrend. Above spot, resistance stacks at $78.86, then the $80-$81 zone anchored by the 100-day moving average, and further up the major long-term resistance near $95-$97. SOL at $76 sits closer to the resistance it must break than the deeper support it must defend, but the range has held either way.
The moving-average structure is the clearest evidence that Solana’s downtrend remains intact despite the recent stabilization. SOL has reclaimed its 20-day exponential moving average near $76.80, a short-term positive, but it continues to trade below its 50-day average near $75-$77, its 100-day average near $81, and its 200-day average near $95-$97. That stacking of moving averages above the market is a sign the longer-term trend is still pointed down, and it is the technical definition of a macro downtrend.
It is easy to confuse a stabilization for a reversal, but the technicals suggest otherwise. Solana has reclaimed its 20-day average, but it sits below the 50-, 100-, and 200-day averages, all of which slope down and act as overhead resistance. The reclaim of the 20-day average is the thin thread of hope, but reclaiming one average out of four while the other three sit overhead is a modest improvement rather than a trend change. The macro downtrend holds until the 200-day average is reclaimed.
Related: Ethereum slides to $1,565 60% below record
The upside for Solana is gated by a well-defined trigger zone, and clearing it is the first step in any recovery. Resistance begins at $78.86 and extends through the $80-$81 zone anchored by the 100-day moving average, and one analyst flagged $77 specifically as the trigger level — the price whose flip into support could open the door toward $125 to $130. A daily close above the $77-$80 zone would be the first real signal that buyers are back in control after the extended downtrend.
The path above the trigger is mapped in stages. A sustained break above $80-$81 would open a run toward $97, where the 200-day moving average currently sits — the major long-term resistance that defines the entire downtrend. Reclaiming the 200-day average would be the technical event that flips the macro structure from bearish to bullish, a far more significant milestone than clearing the near-term $80 resistance. Beyond $97, the $120-$140 zone flagged as the next target comes into view.
The sequence matters because each level is a distinct hurdle. SOL has to first close above $77-$80 to signal buyers are back, then push through $97 to break the macro downtrend, then extend toward $125-$140 to confirm a full recovery. Getting there would likely take more than a few weeks of sustained buying, because the token has to work through layers of overhead resistance built up during the nine-month decline. The path exists, but it is a grind.
The downside for Solana is anchored by a floor that has held through the downtrend, and its defense is the critical near-term question. The immediate support sits at $74.22, backed by the $75.59 level and the shorter-term moving averages near $76.80. But the floor that matters most is the $63-$65 zone — the level traders have watched as the bottom of the range, and the line that has held SOL from falling further during the nine-month decline. Any short-term forecast has to start with that $63-$65 zone as the key support.
A breakdown below that level would likely open the door back toward the low $50s, a level SOL has tested before during the downtrend, and further toward the $50-$55 area that marks the lower edge of the broader corrective channel. Below $63-$65, the supports thin out, and the token would be vulnerable to a sharp move lower as the range breaks down. The $63-$65 floor is the line that separates a consolidation from a capitulation.
The institutional access that was supposed to drive Solana’s demand has stalled, and the ETF data tells the story. The U.S. spot Solana ETF market has around eight sponsoring firms, with the largest fund, BSOL, listed on the NYSE emerging as the biggest holder. The products are distributed across the major exchanges, and collectively they hold about $879.19 million in net assets — representing roughly 1.99% of Solana’s total market capitalization. The cumulative net inflows since listing have reached a significant $1.14 billion.
But the inflows have gone quiet, and that silence is the problem. The last major inflow was recorded on May 11, amounting to $26.57 million, and from that point onward no big inflows have come. The ETF demand that helped establish the products and drew $1.14 billion in cumulative capital has stalled, leaving the funds without the fresh institutional buying that would support the price. The stalled inflows are a key reason the token has been unable to break its range — the structural bid that ETFs provide has faded.
Related: Fashion Forward: Exploring the Allure of Latex Suits and Latex Catsuits
Spot ETFs hold the underlying asset, so inflows translate into buying of Solana and outflows into selling. When the inflows stall, the mechanical bid disappears, and the token loses a source of demand that would otherwise help absorb selling and drive the price higher. The $879.19 million in net assets is meaningful, but at just 1.99% of the market cap, the ETF holdings are not large enough to move the token on their own — and with no fresh inflows since May, they are not adding to the position.
The fundamental bull case for Solana rests on its technical advantages as a blockchain, and they are genuine. Solana offers high throughput — the ability to process a large number of transactions per second — and low transaction fees, a combination that makes it attractive for decentralized-finance applications, payments, and high-frequency on-chain activity. Those characteristics differentiate Solana from slower, more expensive networks and position it as a leading platform for applications that require speed and low cost.
The comparison to Ethereum frames the opportunity. Solana could outperform Ethereum on shorter timeframes due to its higher throughput, expanding decentralized-finance activity, and lower fees. While Ethereum remains the dominant smart-contract platform, Solana’s rapid ecosystem growth and technical advantages support the view that SOL may deliver stronger percentage gains if the key resistance levels trigger the next bullish phase. The token’s speed-and-cost advantage is the fundamental basis for the argument that it can outpace its larger rival in a recovery.
The ecosystem growth is the engine that converts the technical advantages into value. Expanding decentralized-finance activity, growing developer participation, and increasing application deployment all drive demand for the token, which is used to pay transaction fees and secure the network. A thriving ecosystem generates organic demand for SOL independent of speculative flows, and the network’s throughput and low fees are what attract the developers and applications that build the ecosystem. The technical case and the ecosystem case reinforce each other.
A troubling divergence sits beneath Solana’s price action, and it goes to the heart of the token’s value. On-chain data reveals a stark split between sinking user activity and soaring bullish chatter — the actual usage of the network is declining even as the social sentiment turns more optimistic. That divergence is a warning sign, because a network’s value ultimately rests on its usage, and falling activity undercuts the fundamental case regardless of how bullish the community becomes.
The split reflects a market where narrative is running ahead of fundamentals. Bullish chatter — the social-media optimism, the price targets, the recovery narratives — has soared even as the on-chain metrics that measure genuine network usage have declined. When the talk outpaces the activity, the risk is that the price is being supported by sentiment rather than substance, and sentiment can reverse quickly. The divergence raises the question of whether the recent stabilization reflects real demand for the network or merely hope that the demand will return.
The sinking activity is the more concerning half of the divergence. Solana’s investment case rests on its network — the throughput, the low fees, the decentralized-finance activity, the developer ecosystem. If user activity is declining, the fundamental engine that justifies the token’s value is weakening, and the range-bound price may be reflecting that erosion. The bullish chatter cannot substitute for actual usage; a network needs users transacting, building, and generating fees to sustain its value over time.


